Server Monitoring
Continuous visibility into server health, performance and availability, with alerts routed to people who can act.
Overview
We monitor server health, performance and availability around the clock, with alerting and escalation.
- CollectionAgents or agentless probes using SNMP and WMI.
- MetricsCPU, memory, disk, network and service metrics, plus event logs and syslog.
- AlertingThreshold and anomaly rules alert on-call engineers.
- DashboardsAvailability and capacity trends across servers and cloud instances.
Technical scope
- CPU, memory, disk, network and service monitoring
- Windows and Linux servers, virtual machines and cloud instances
- Application, database and URL availability checks
- Event log and syslog monitoring
- Threshold and anomaly alerting
- Capacity trending and reports
- Incident escalation to agreed SLAs
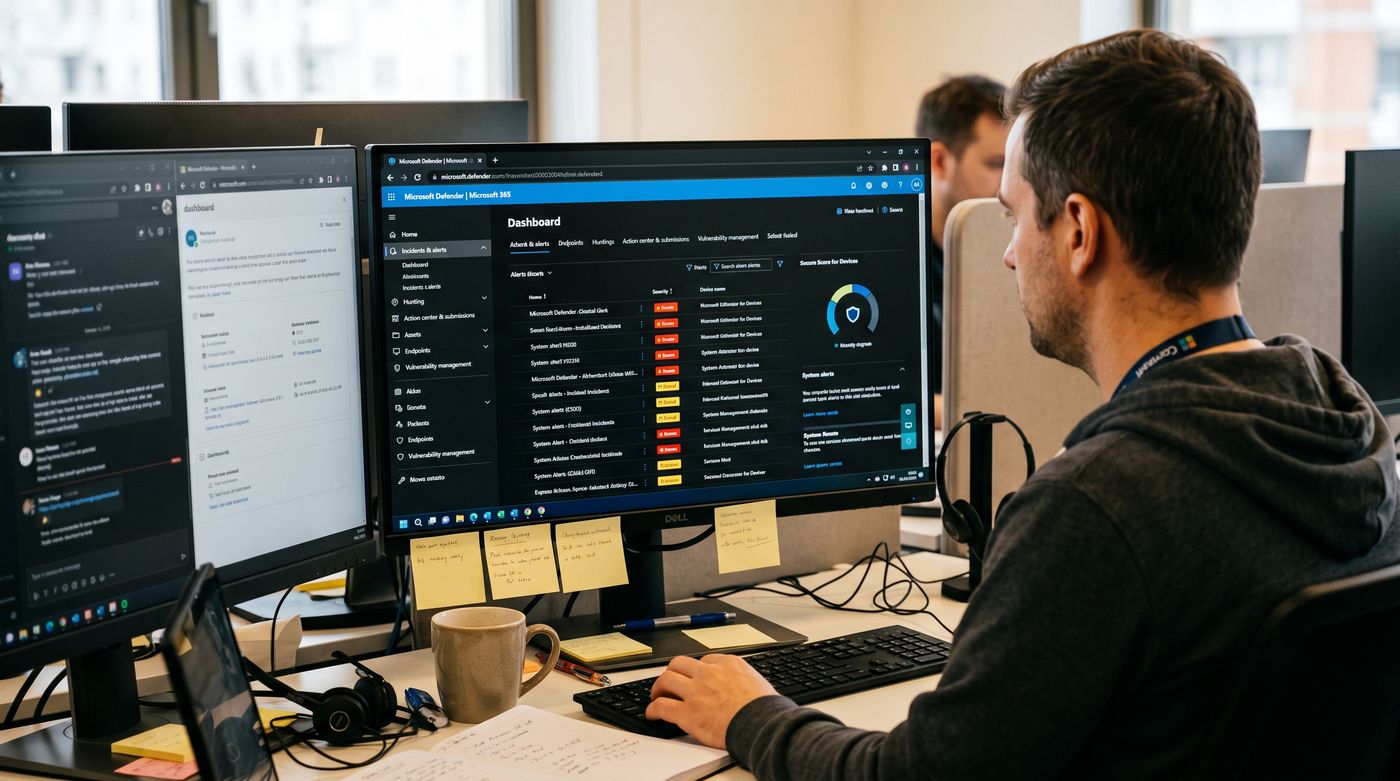
Architecture and how it works
Agents or agentless probes send metrics and logs to a monitoring platform. Rules compare them with thresholds, alerts reach on-call engineers, and dashboards show availability and capacity.
Delivery process
- 01
Inventory
Inventory servers and services
- 02
Deploy
Deploy agents and probes
- 03
Alert
Set thresholds and alert routes
- 04
Respond
Monitor and respond 24/7
- 05
Review
Review reports and capacity monthly
Tools and deliverables
The monitoring design lists monitored hosts, metrics, thresholds and alert routes with severity and escalation timings. Monthly reports show availability, performance trends and capacity forecasts, with incident records for every alert escalated.
Deliverables
- Monitoring design
- Alert matrix
- Dashboards
- Monthly availability and capacity report
- Incident records

Common questions
How is data collected from servers?
Agents or agentless probes gather CPU, memory, disk, network and service metrics, plus event logs and syslog, using protocols such as SNMP and WMI. The choice depends on the server and your network, and the data is sent to a central platform where it is compared against thresholds and trended over time.
How are alert thresholds set?
Thresholds are agreed per server role, and anomaly rules catch unusual behaviour that fixed limits miss. Alerts carry a severity and route to on-call engineers, with escalation to agreed SLAs if they are not acknowledged, so the right person is told about the right problem in time to act on it.
What checks go beyond server health?
Application, database and URL availability checks confirm that services actually respond, not just that the server is up. A server can be running while a web application or database is failing, so these checks test the service from a user's point of view and alert on the real impact.
How is capacity planned?
Trend data on CPU, memory, disk and network use feeds monthly reports and capacity forecasts, so upgrades can be planned before limits are reached. Growth patterns are visible on dashboards, which supports budgeting and avoids emergency purchases or downtime when a disk fills up or memory runs short.